When I got the results of the scan I was hoping for a little more detail, and a look at the results themselves, but this was not to be. This, therefore is a quick post about my experiences in the MRI scanner back in 2017.
There was quite a bit of hassle getting the scan organised in the first place. In the end I had to send copies of letters to particular teams to demonstrate that the scan had been requested by my neurologist. I understand that resources are tight, but it seemed somewhat difficult to arrange. On one side I can imagine that other people might have given up on this activity, but also if their diagnosis is uncertain then they are much more likely to be persistent as the scan could reveal any number of things.
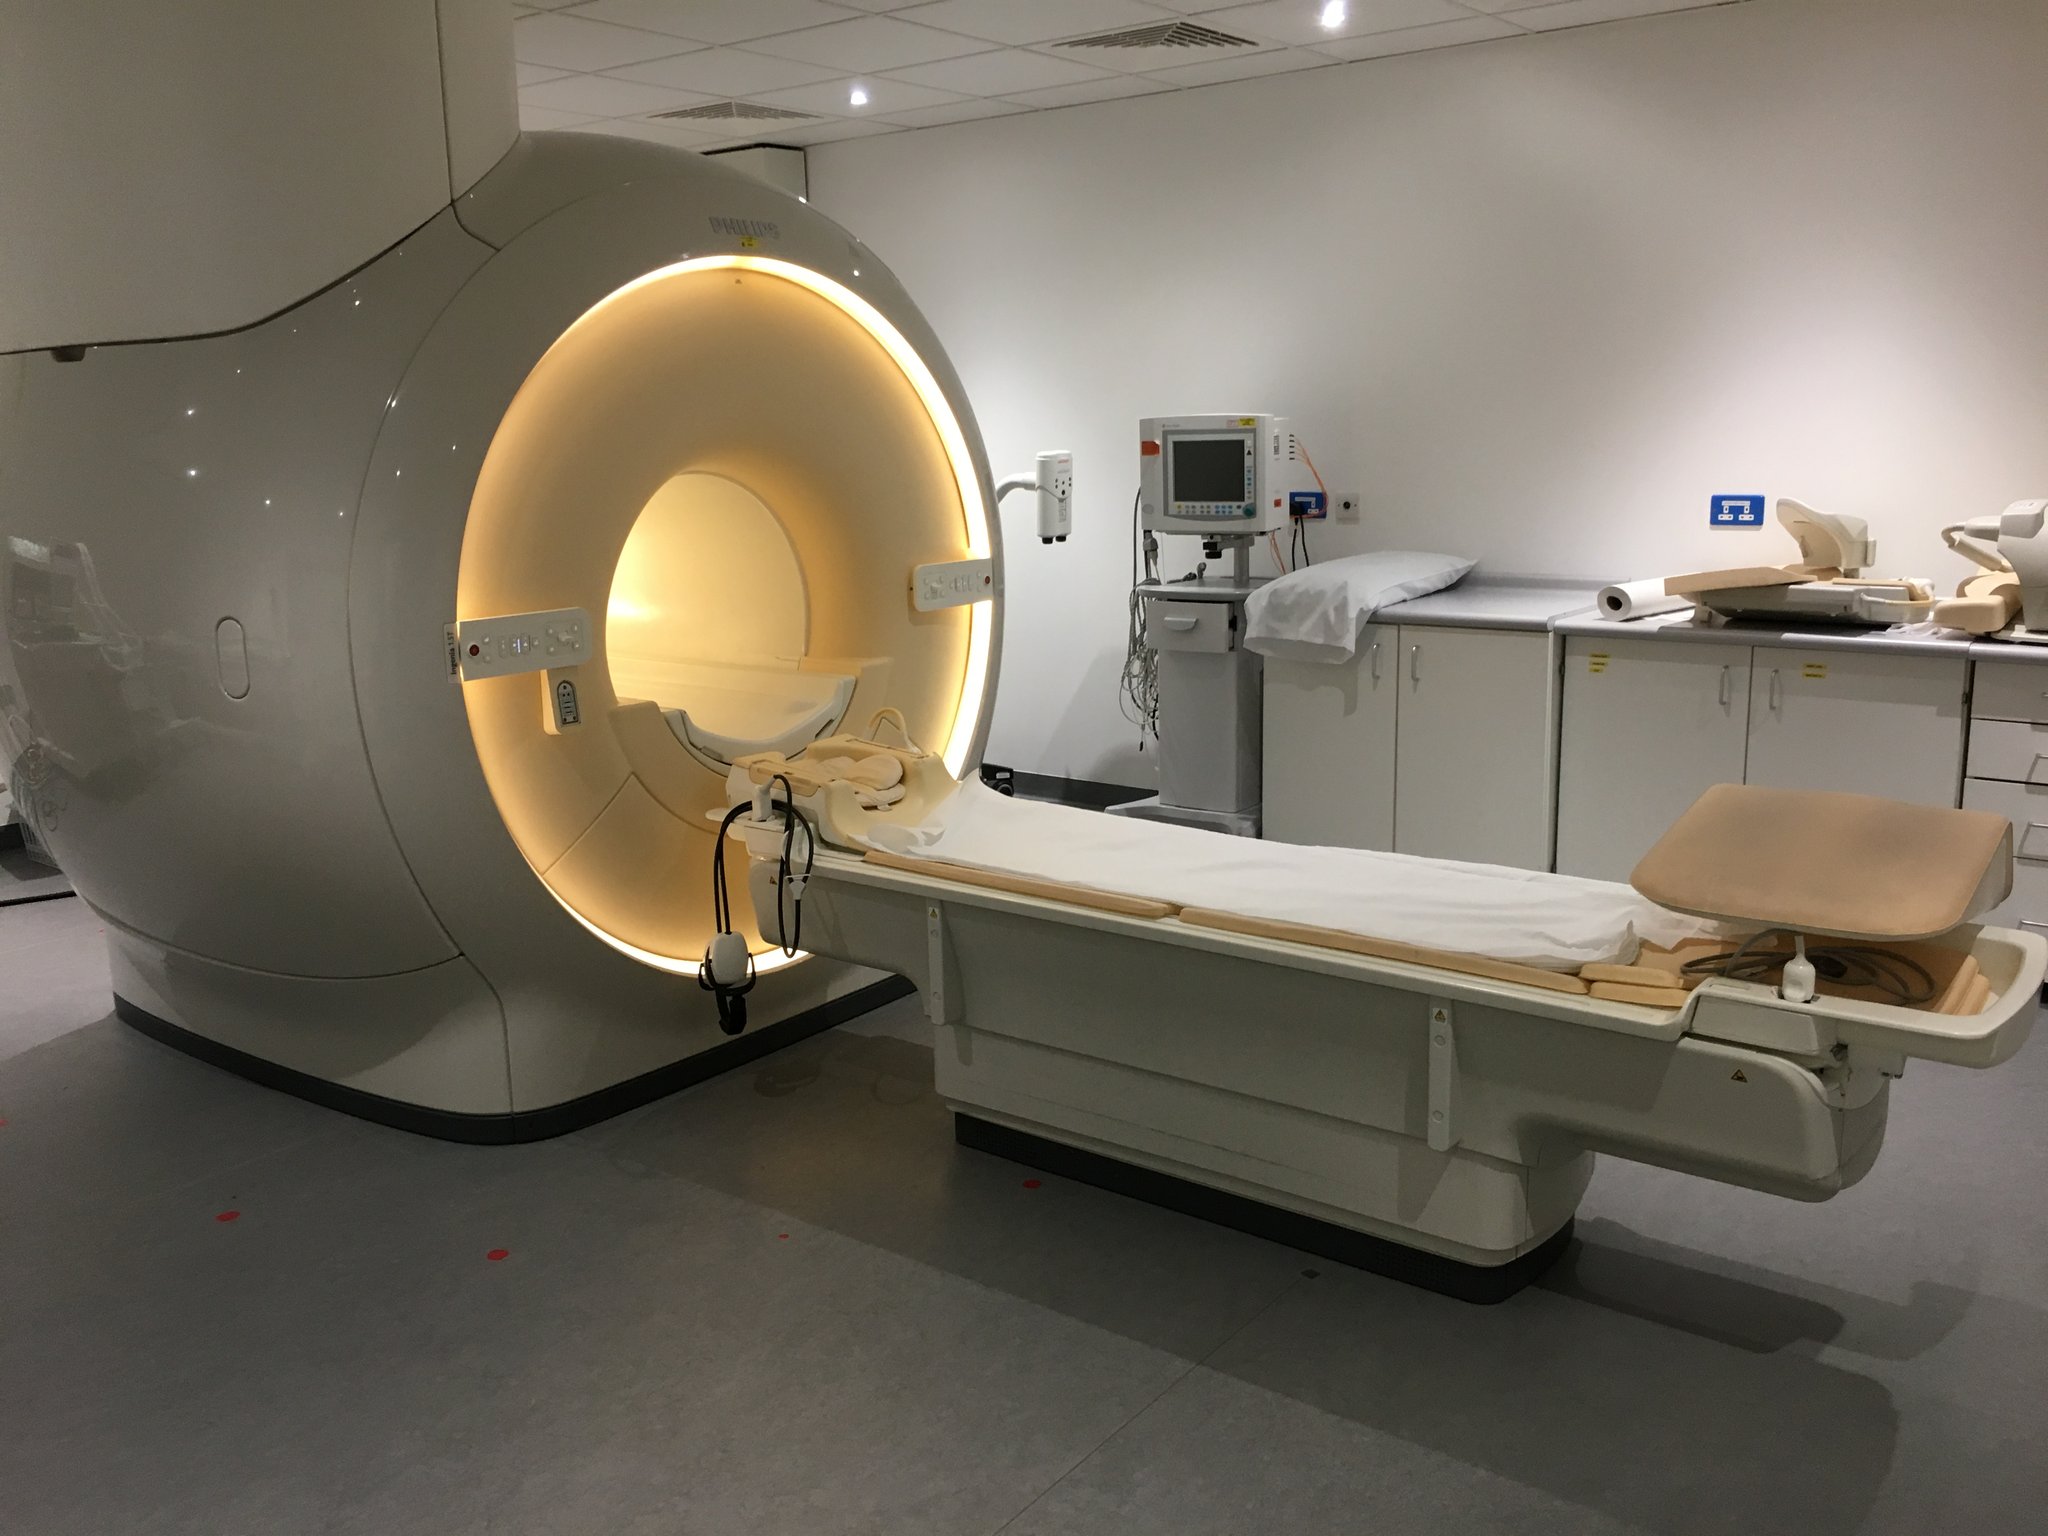
My scan took place in September 2017, and this is what the scanner looked like:
There is a cross-over between my work and HSP here. MRI scanners are quite noisy. The levels are such that you have to wear hearing defenders in the scanner. The hearing defenders include speakers so that the team can talk to you whilst you are in the scanner. They asked me what I would like to listen to whilst my scan was taking place. I said Radio 4. However, the noise of the scanner was such that I couldn't actually hear what was being said most of the time. Therefore, my recommendation is to choose something musical if you're asked the same question!
I found the sounds of the scanner quite interesting, there were many different repetitive sounds which made various rhythms during the scan. I was inside the scanner for an hour or two. My scan was brain and spine, so they did two separate scans.
I heard the results of the scan at my HSP appointment in London in 2018. Quite simply, everything was as expected. There has been a minor amount of degradation of the nerves, and there are no surprises.
What I was interested to know was:
- How much degradation there was.
- Was the degradation distributed evenly along the nerves, greater at the far end of the nerves or unevenly distributed.
- As I have both leg and bladder issues I would have been keen to see if the degradation between muscle nerves and bladder nerves was similar.
- If there are any hints about possible degradation in other nerves.
- The mathematician in me would have liked some kind of percentage degradation.
I had hoped to be able to see the images of the scan, but that seems not to be the way the system works - They didnt have them on screen at my appointment, and it seems that it wasnt possible to get them on screen at that time.
My conclusions from this - the experience of having an MRI scan was interesting. I'm pleased to know that there were no surprises revealed by the scan, and that everything is as expected.
Update - I have just found the letter which was sent to my GP about the results - The imaging is "fairly unremarkable", and there are no abnormalities, and the corpus callosum was very slightly thin. The corpus callosum is the nerve fibre bundle which joins the two halves of the brain together.